Configuring Azure Application Insights in an Angular application


Because you're already here, I'm assuming that you're already familiar with Application Insights, and that you're looking at how you can configure it within an Angular application. So I'm not going to waste any time, and we're diving right in.
Installing Application Insights libraries
The first thing we need to do is to install the required libraries @microsoft/applicationinsights-angularplugin-js and @microsoft/applicationinsights-web.
Configure Application Insights with the Angular plugin
Next, we define an Insights service that acts as an abstraction layer around the building blocks that both libraries provide. This service consumes the Application Insights JavaScript API to initialize an ApplicationInsights instance that is configured with the Application Insights Instrumentation Key. To hook into the Angular route lifecycle, which is required to send accurate page view data to Application Insights, the AngularPlugin is added to the extensions.
Notice that I'm not using the environment to set the instrumentation key, instead, I prefer to use a configuration file to only build my application once and deploy the same build to multiple environments.
Later, the Insights service can be injected into the Angular application to send events or traces to Application Insights. Therefore, some methods are exposed on the service.
In the example above, only the required configuration options are set, for the full reference of the available configuration options, see Application Insights JavaScript configuration options, and the Angular plugin configuration.
Sending errors to Application Insights
The next step is to import the Insights service into an Angular module.
You can do this inside of the AppModule, but I prefer to create an extra Angular module.
This module groups all of the insights related pieces into a single Angular module.
To send the exception information to Application Insights, the ApplicationinsightsAngularpluginErrorService is configured as the default Angular ErrorHandler.
Because the Angular error handler is overwritten with the application insights error handler, the default behavior that errors are logged to the console is removed.
This isn't very handy while we're developing, because we don't notice the errors anymore.
To re-enable the default behavior, the default Angular error handler ErrorHandler is added to the errorServices collection of the AngularPlugin within the Insights service that we created in the previous step.
Initialize the Insights service
The Insights service must be initialized before it can start logging views and exceptions. You can do that by injecting the service in the InsightsModule module. This way when the InsightsModule is loaded, the Insights service is also initialized.
The last step is to add the InsightsModule to the imports array of the AppModule.
Now, all page views and exceptions are logged to Application Insights.
Helpful stack traces in Application Insights
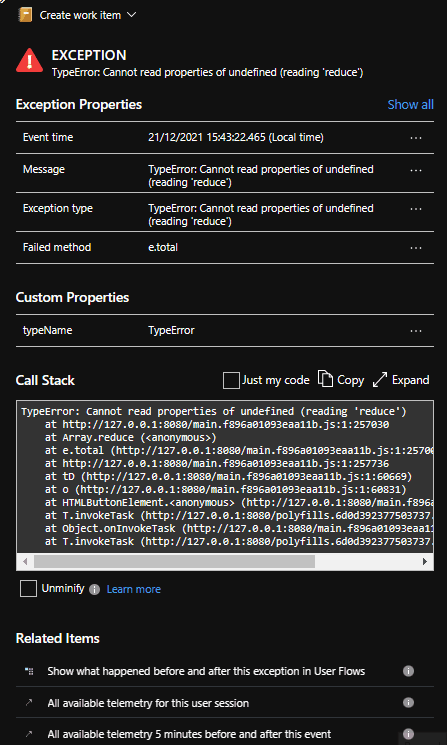
Unfortunately, the stack trace of an error isn't very helpful in Application Insights because it logs the minified version of the code. This makes it hard to find the root cause of the error, and where the error occurred.
For example, take a look at the following stack trace.
It tells us the error is at main.f896a01093eaa11b.js:1:257030, but good luck figuring this out.
To make this readable and useful there's an option to unminify the code, resulting in the following stack trace, which is a lot better.
We can clearly see which component and/or method caused the error and also the line number, in this case, webpack:///apps/example-app/src/app/app.component.ts:29:26.
To enable this option, we need to upload the source map files to Application Insights. This can be done by manually dragging and dropping the source map files on the stack trace window, but this isn't very convenient.
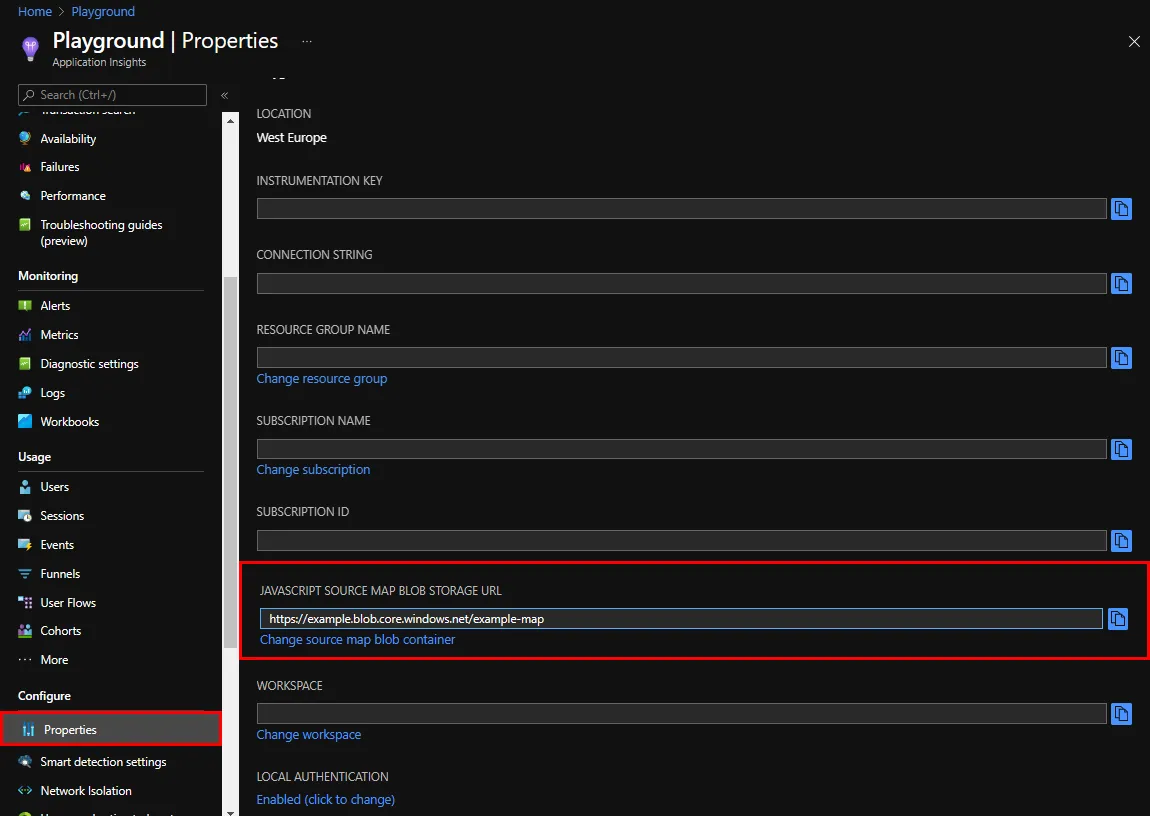
There's also another option to automatically have the source map files available. For this, we need to create a container within an Azure Storage Account. When the container is created, you can upload the source map files via Azure or within your CI/CD pipeline by using the Azure File Copy task. For a detailed guide on how to do this, see the docs, or the Azure blog.
Once the storage container is configured, you can set it as the default source map URL within your Application Insights properties.
You can now switch to a better-looking stack trace.
Sending custom events and traces to Application Insights
Lastly, because we wrote the Insights service we can inject the service into Angular components and services. This allows us to send custom events and traces to Application Insights with the trackEvent and trackTrace methods, which we've exposed in the Insights service.
Conclusion
To make it easy to send data to Azure Application Insights in your Angular application, we make use of the Application Insights SDKs from Microsoft.
We've bundled the two libraries in a custom Insights service and module. This isolates the code from the rest of the application and makes it easy to change in the future if the API changes.
This also has the advantage that we can inject our Insights service into Angular components and services to send custom events and traces to Application Insights.
We've also seen how to make the stack traces in Application Insights readable by uploading the source map files into Azure Storage.
Outgoing links
Feel free to update this blog post on GitHub, thanks in advance!
Join My Newsletter (WIP)
Join my weekly newsletter to receive my latest blog posts and bits, directly in your inbox.
Support me
I appreciate it if you would support me if have you enjoyed this post and found it useful, thank you in advance.
