Adding .NET Code Coverage to your Azure DevOps pipeline


It's been a while since I've measured the code coverage in a .NET project, but recently I was interested in the current state of coverage for a project I'm working on. While Visual Studio and Rider have built-in tools for measuring code coverage, I wanted to configure it within our Azure pipeline. Because this took me several tries to set up correctly, I'm writing this post as a future reference and maybe it can be of help to you as well. I was also positively surprised that Azure DevOps also improved its experience since the last, and I think this is a feature most developers don't know exists.
- Creating a pipeline
- Adding code coverage
- Pull request comments
- Enforcing a minimum code coverage
- Code Coverage for different kinds of tests
- Conclusion
Creating a pipeline
If you're already familiar with Azure DevOps and pipelines, you can skip this section and move to Adding code coverage.
To create an Azure Pipeline go to the pipelines tab in your Azure DevOps project and click on the "New pipeline" button. This should bring you to the page https://dev.azure.com/ORGANIZATION/PROJECT/_apps/hub/ms.vss-build-web.ci-designer-hub. On this page follow the steps to create a new pipeline or import an existing one from a repository.
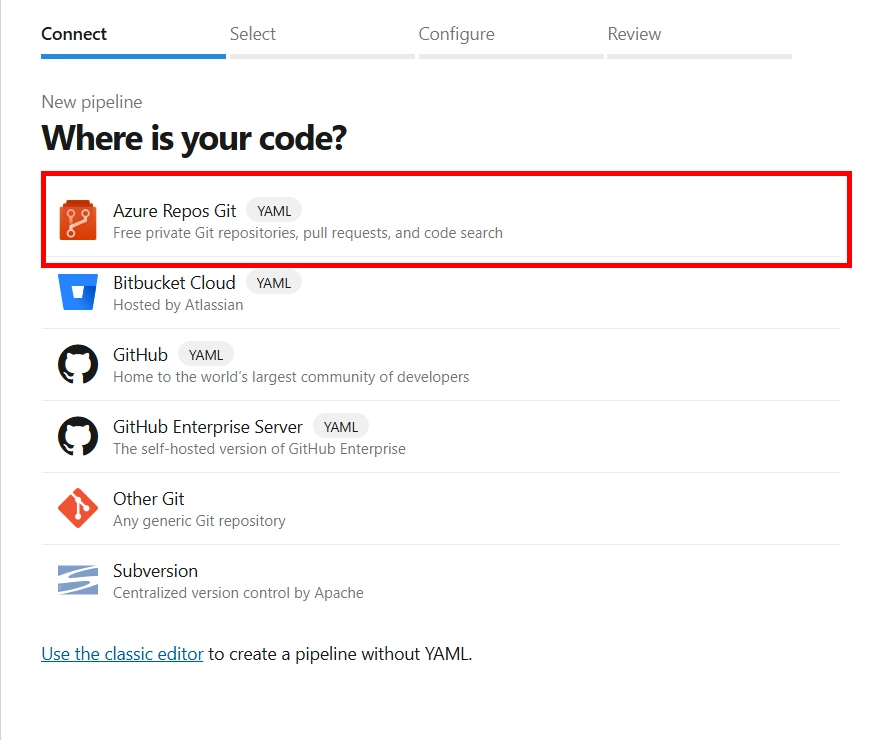
The first step is to select the source of the code, which can be a repository in Azure Repos, GitHub, Bitbucket, or other Git repositories. Because our code is hosted in Azure Repos, we select this option.
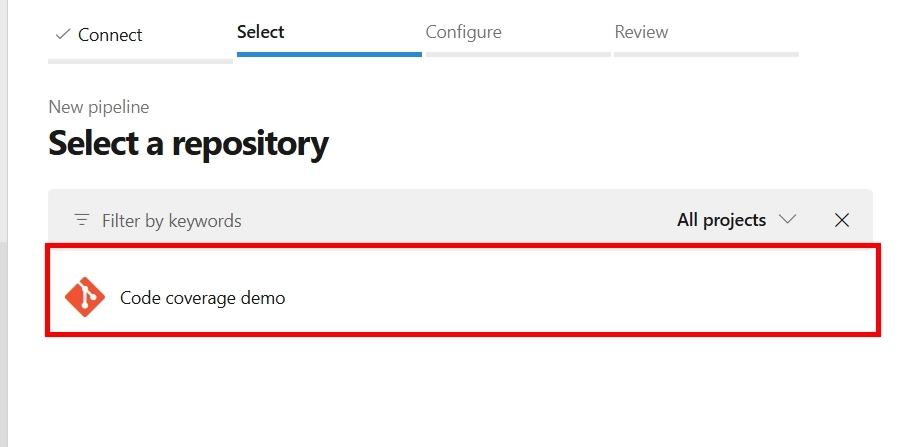
The next step is to select the repository.
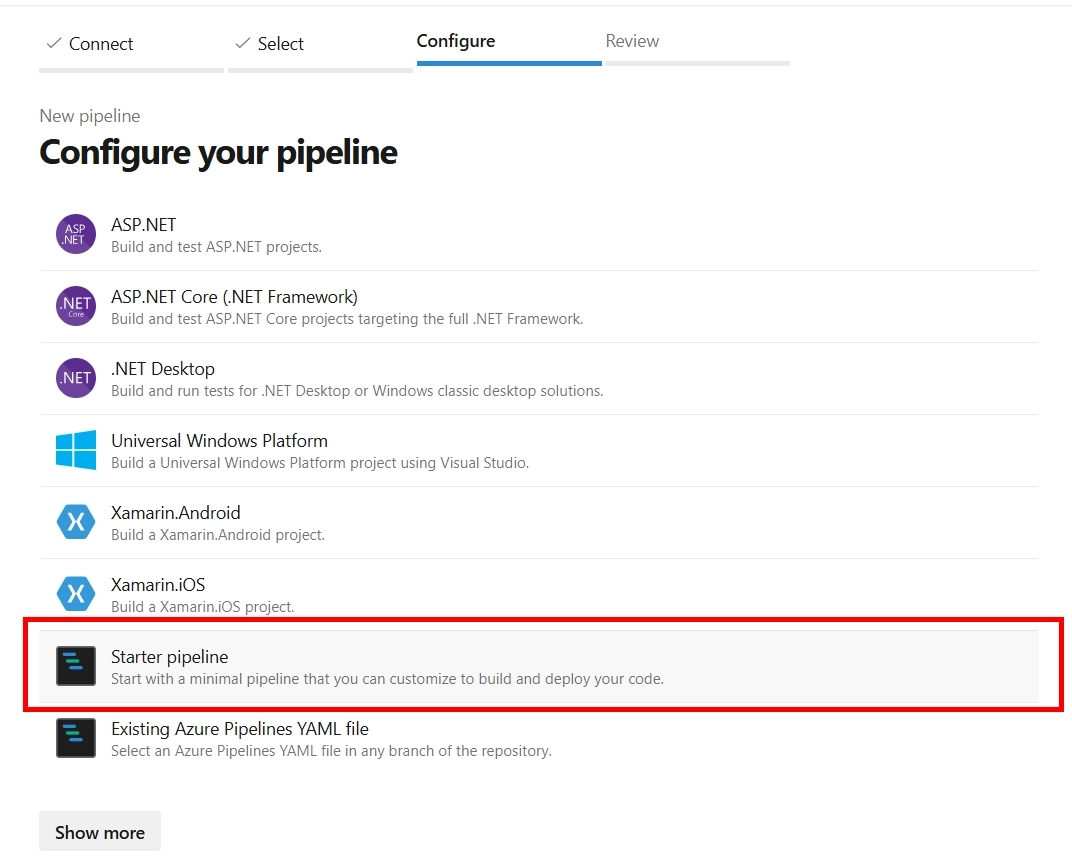
Lastly, either create a new pipeline or select an existing one in the repository. In this case, we'll create a new pipeline.
After this step, you will see a pipeline editor to configure the pipeline. If you choose to import an existing pipeline, select the pipeline that you want to use.
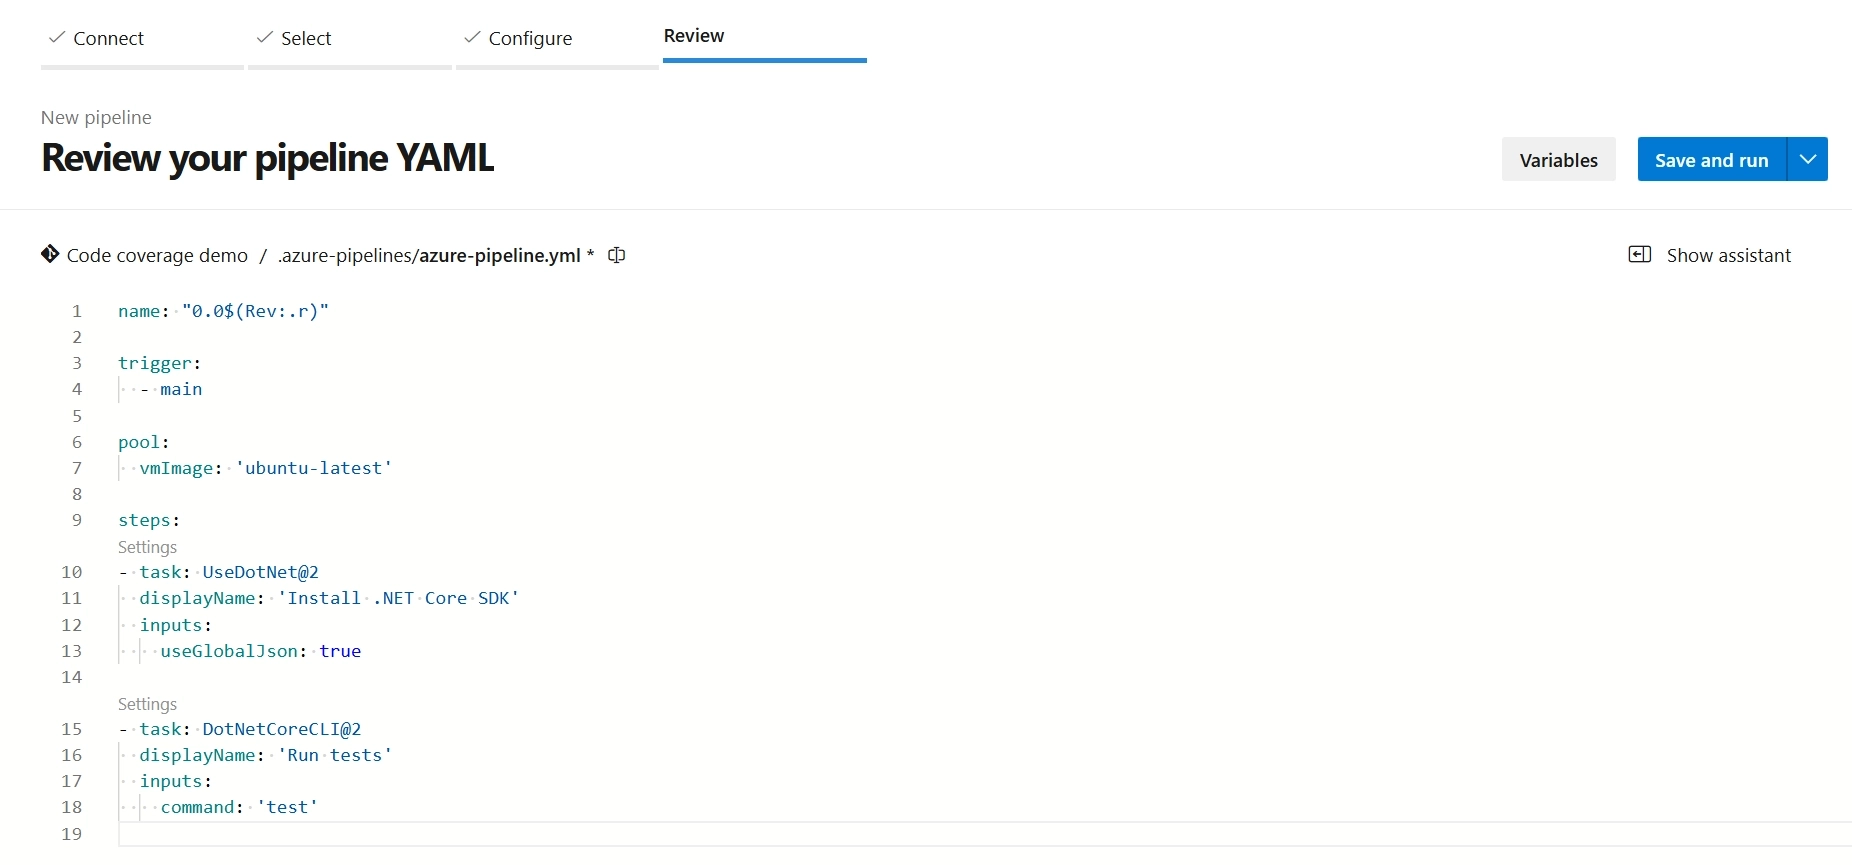
You can copy-paste the example below to configure a simple pipeline that runs the tests for your project.
The pipeline is triggered when a change is pushed to the main branch and uses the UseDotNet task to install the .NET Core SDK and the DotNetCoreCLI task to run the tests.
When you're done, click on the "Save and run" button to save the pipeline and run it.
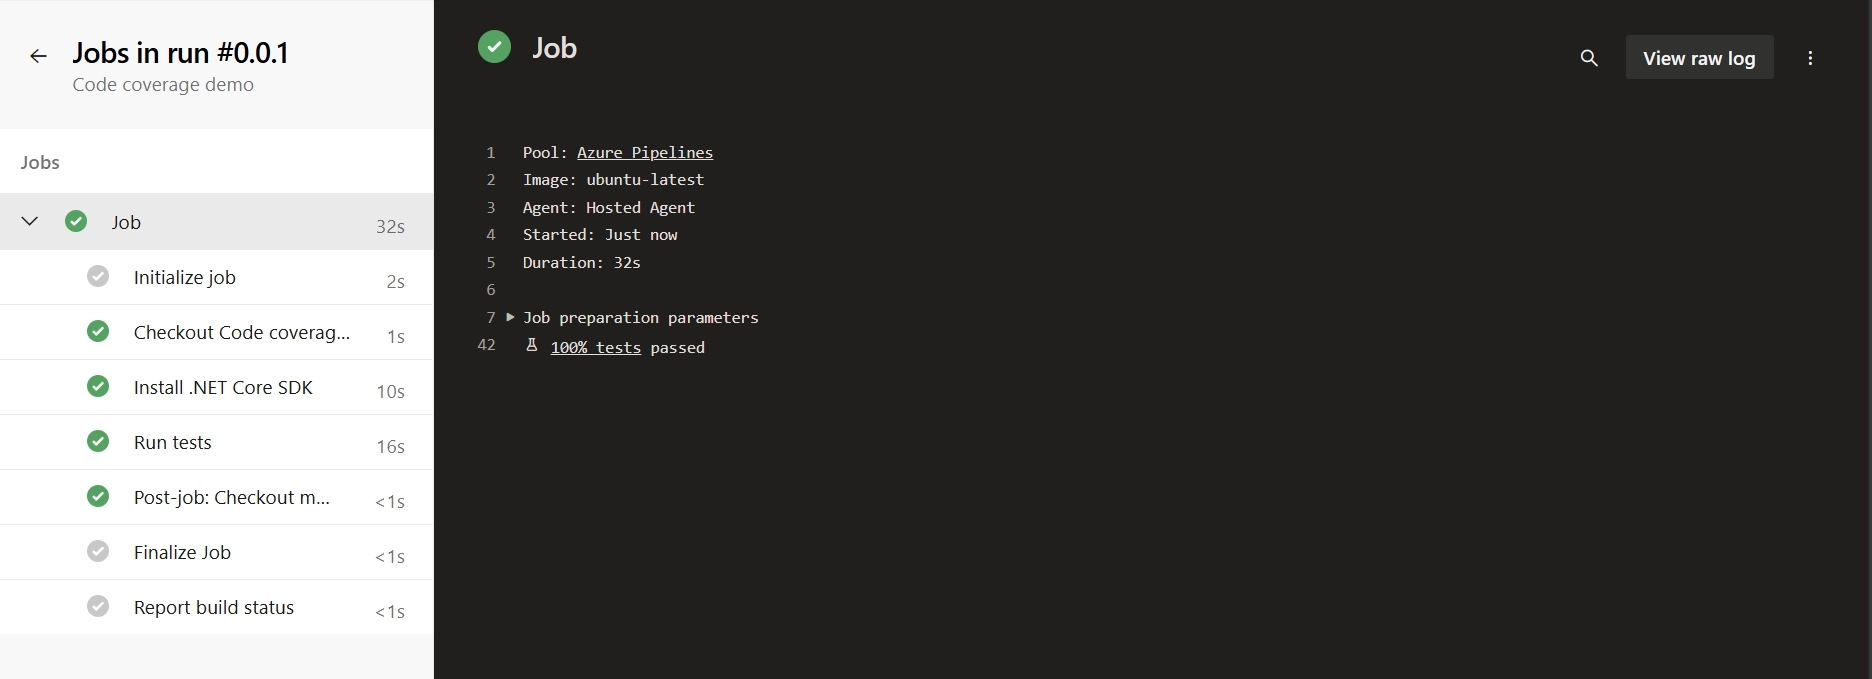
After pushing this change to the main branch, the pipeline should trigger and execute the steps.
When you open the details you should see the pipeline running, and the tests being executed.
Run the pipeline when a pull request is created
So far, the pipeline is triggered when a change is pushed to the main branch.
Ideally, you also want to run the pipeline when a pull request is created to validate the changes.
For this, a policy needs to be added to the main branch.
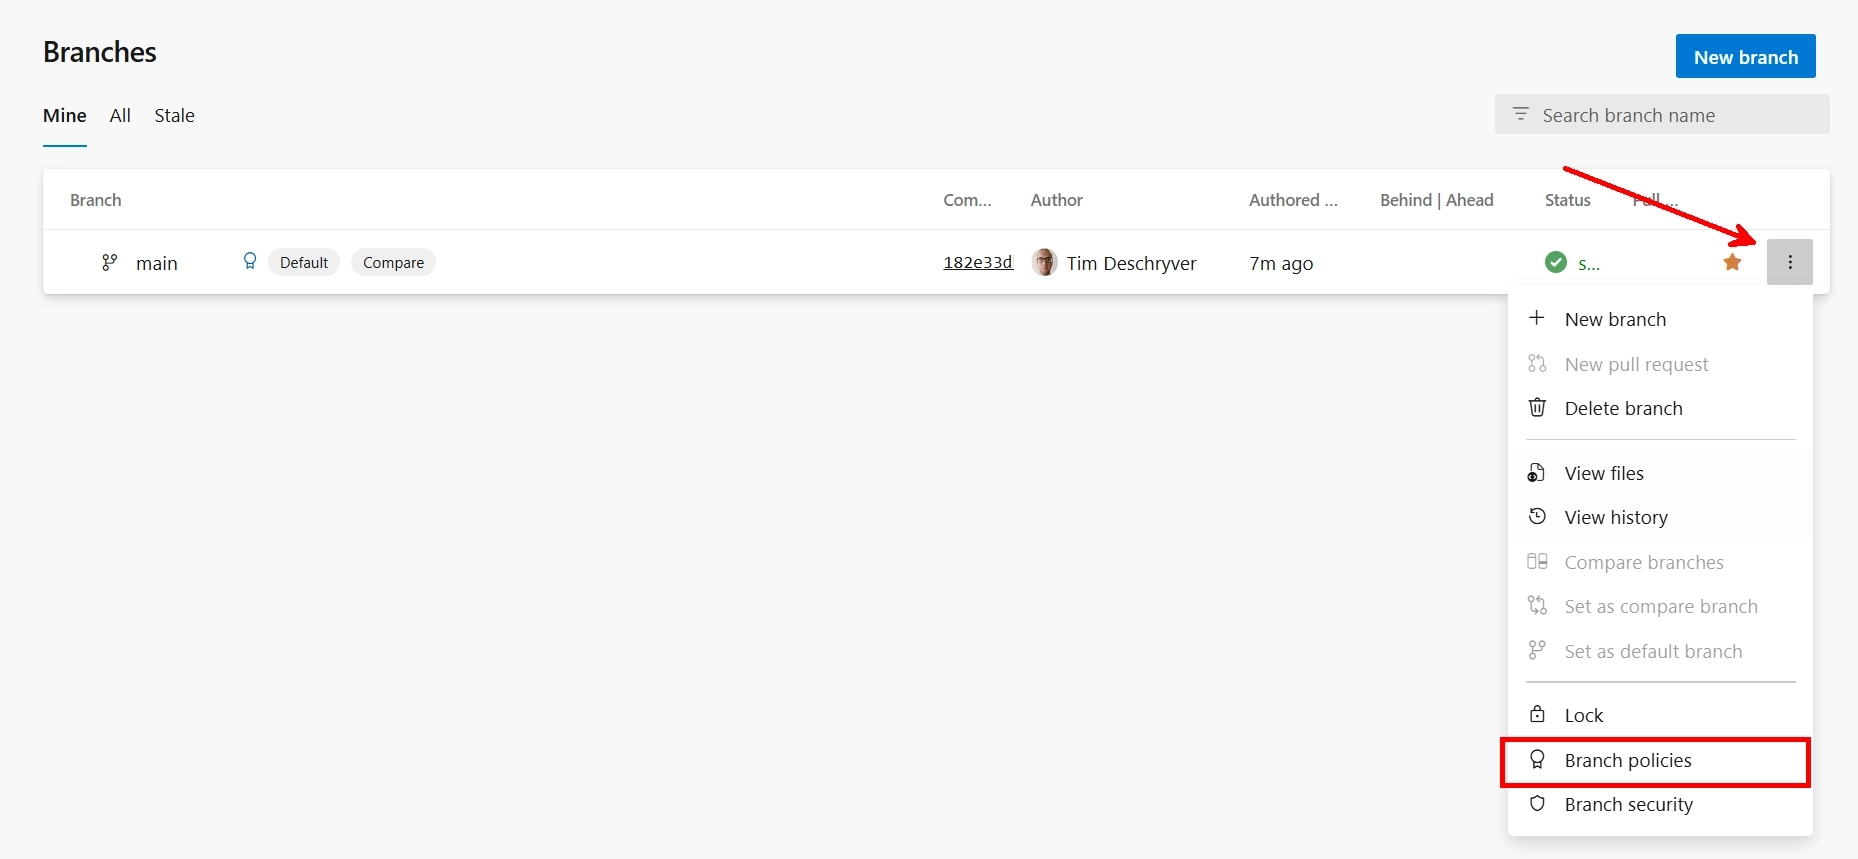
Go to the branches tab in your Azure DevOps project, and open the branch policies of the main branch (hover with your mouse over the branch, and click on the 3 dots).
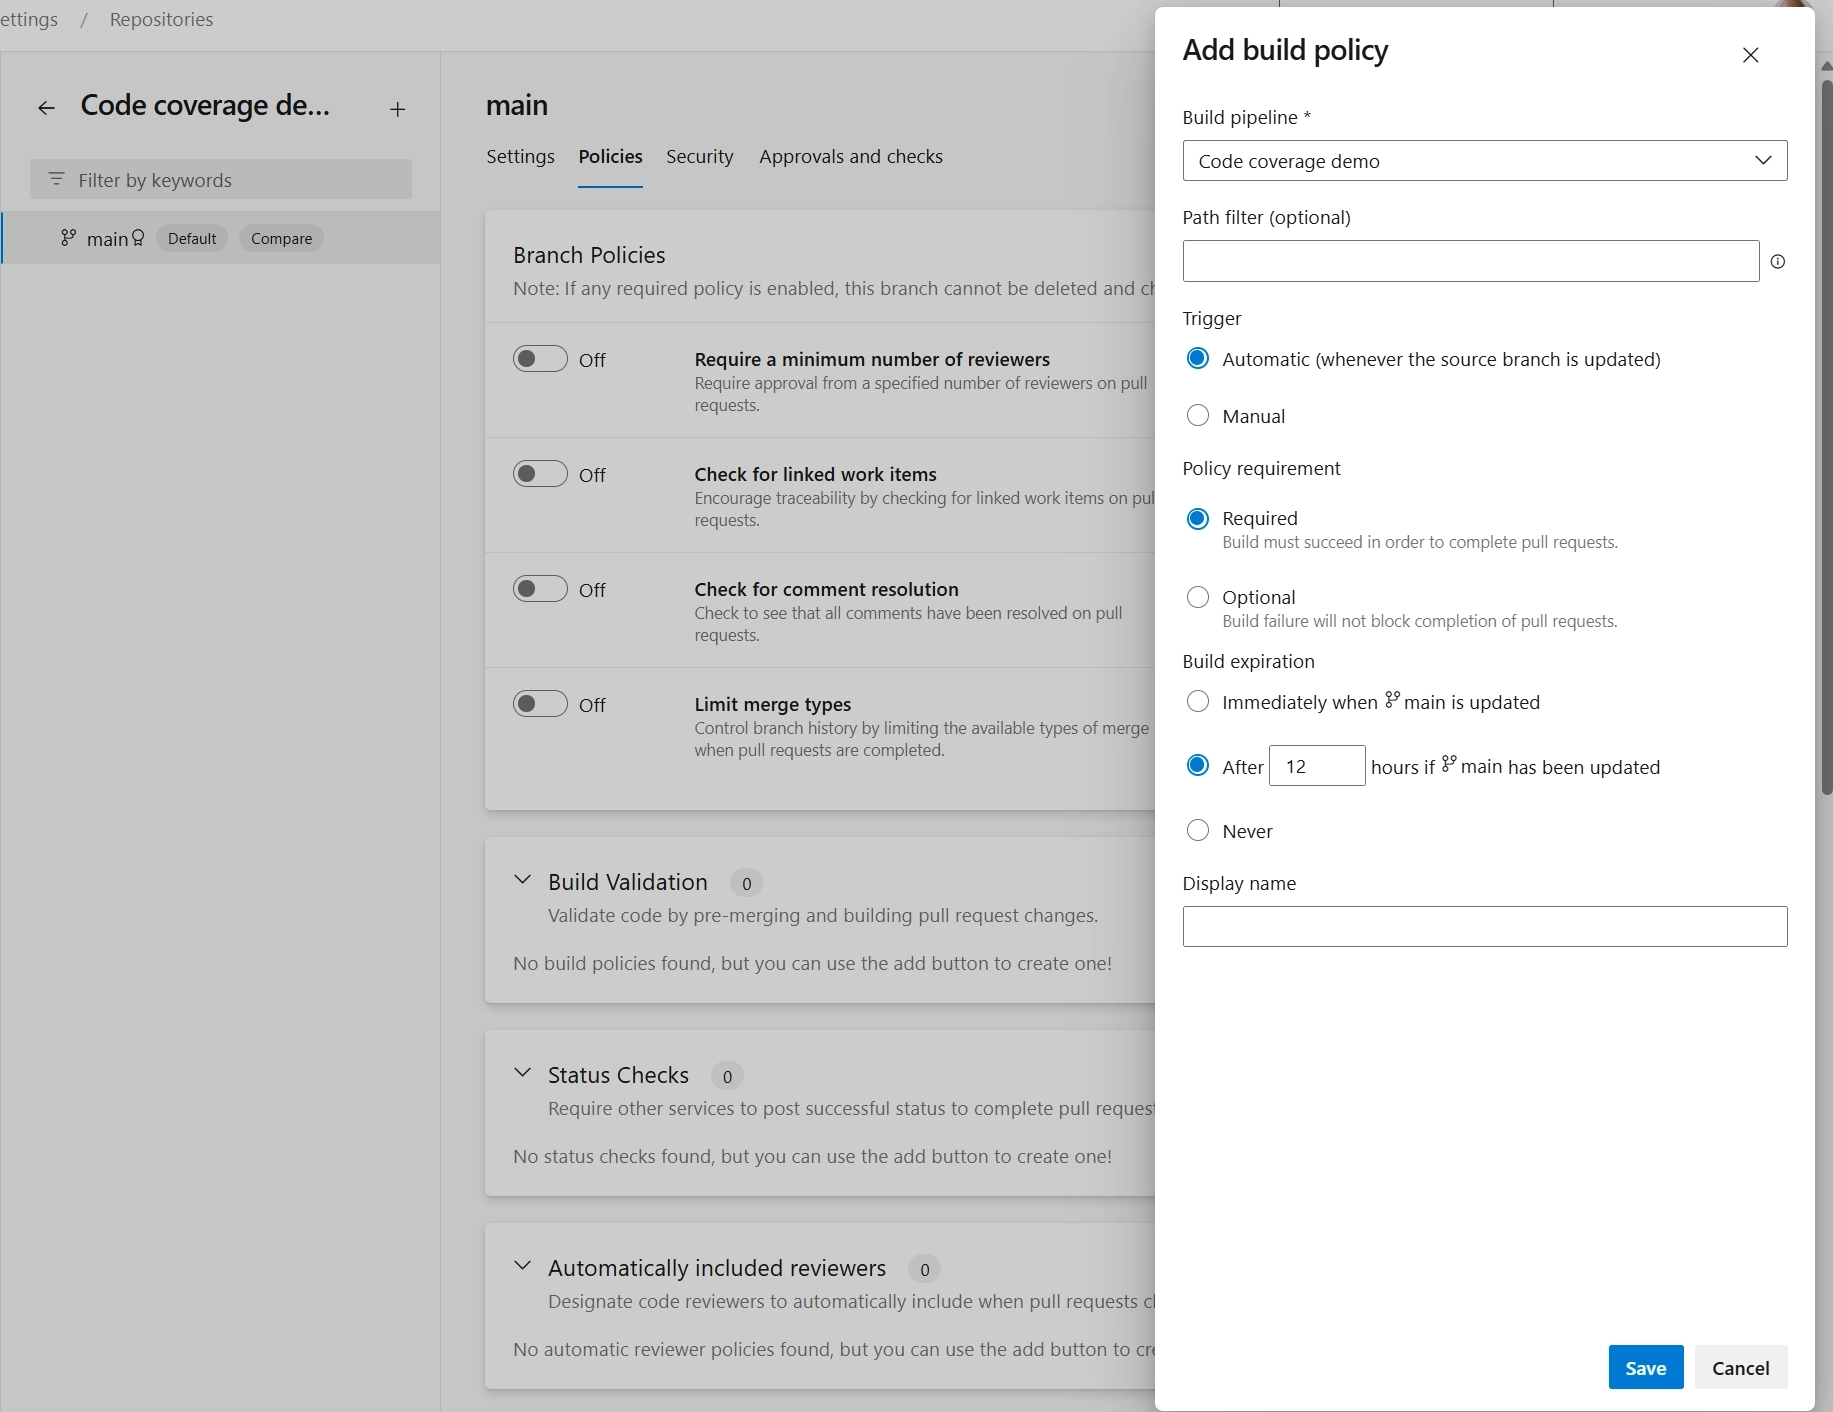
Click on the "Add build validation" button to add a build validation policy.
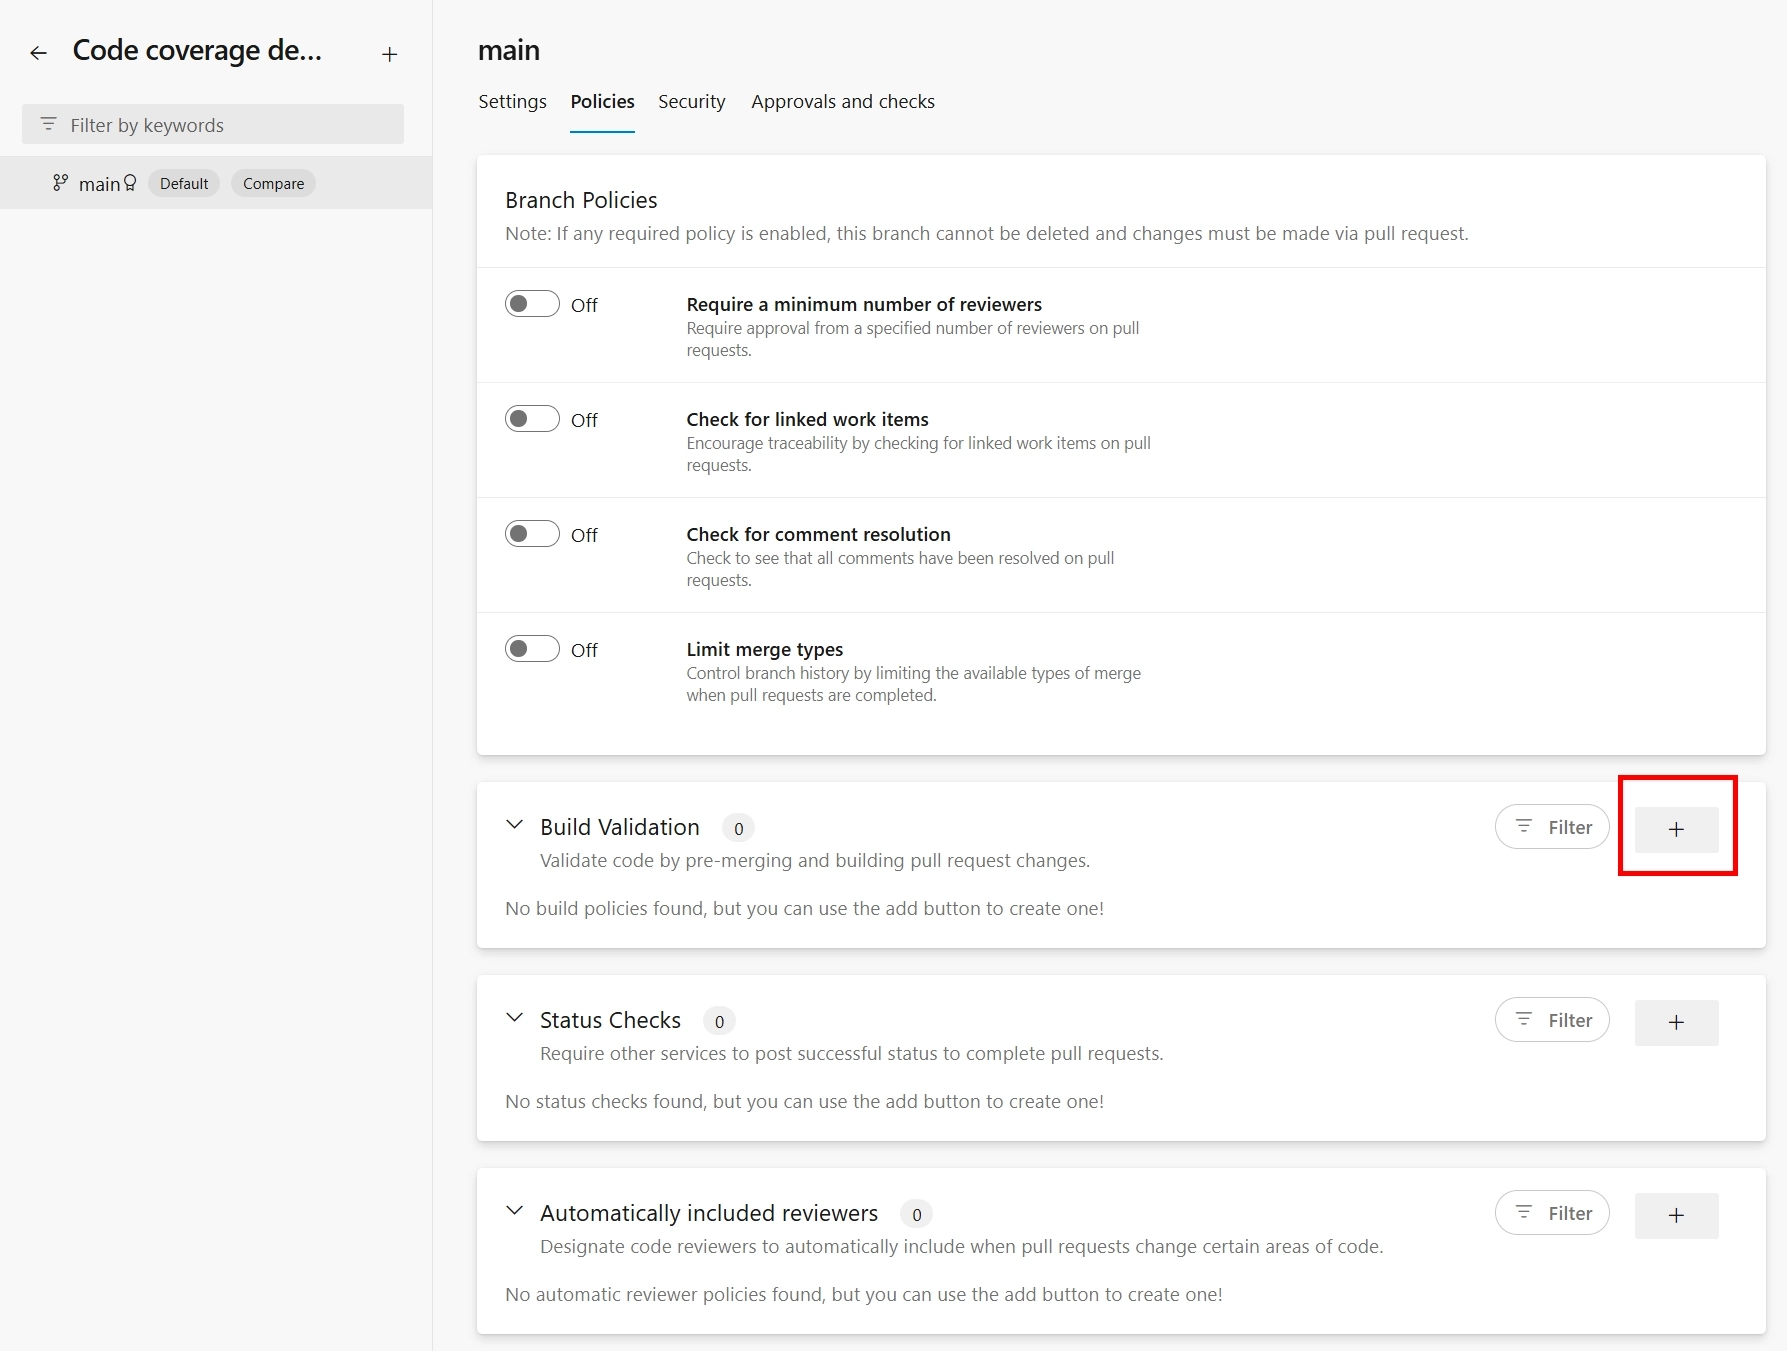
Select the pipeline you created earlier (this should be already a selector) and click on the "Save" button. Additionally, you can also give it a proper name. This name will be displayed in the pull request. The default name is the name of the pipeline.
This step denies that commits can directly be pushed to the main branch, and forces you to create new branches that can be merged using pull requests.
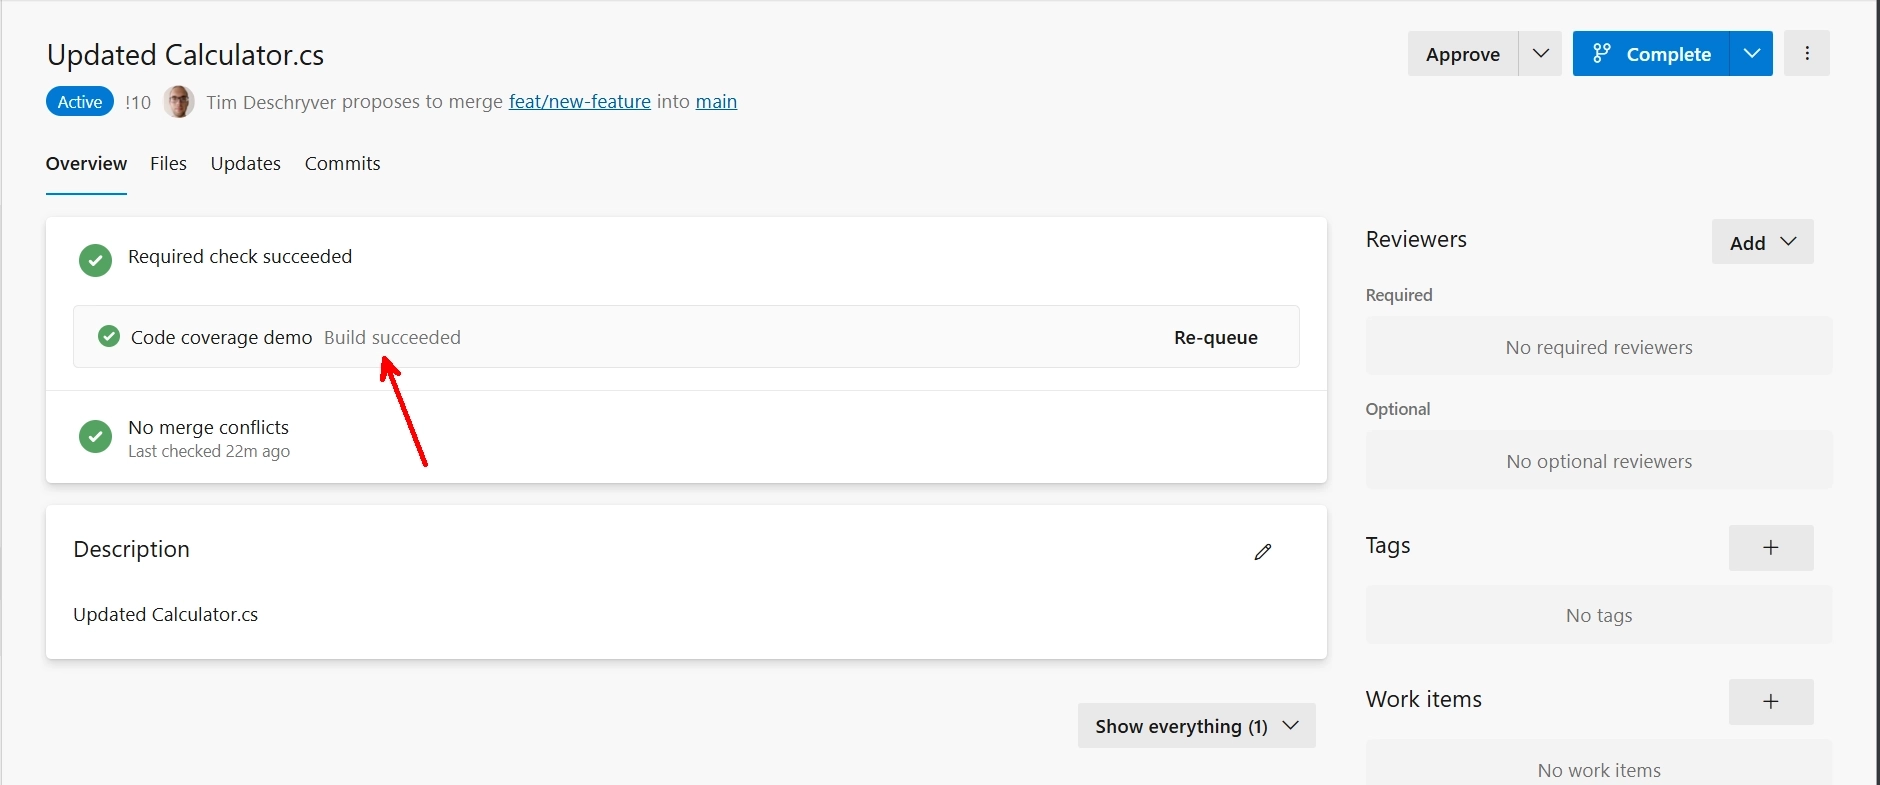
When a pull request is created, the pipeline is triggered and the changes are validated.
Adding code coverage
As it turns out, adding code coverage to the pipeline is not as hard as I reminded it to be.
To collect the code coverage, add the --collect argument to the test command. This argument accepts a data collector, which can be Code Coverage or XPlat Code Coverage. Both have the same result, but there are some nuances between their behavior.
I prefer to use the Code Coverage data collector because I think it's more straightforward.
Let's take a look at the updated pipeline.
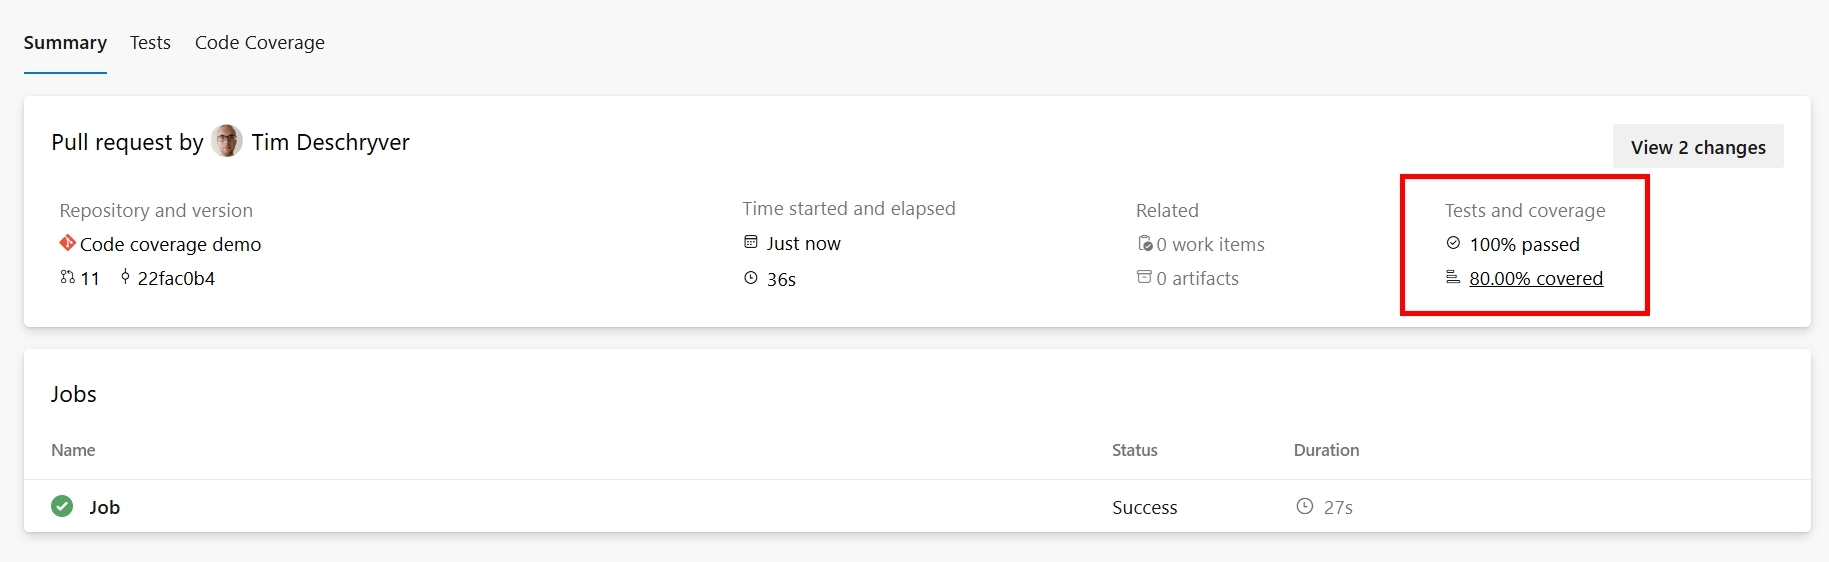
After this change (and running the pipeline), you should see the code coverage in the test results. On the overview page, you can see the percentage of the code coverage.
When you click on it, you will see the details of the code coverage. For more details about the coverage, you can download the coverage file and open it in Visual Studio. This experience will highlight the code that is covered and not covered by the tests.
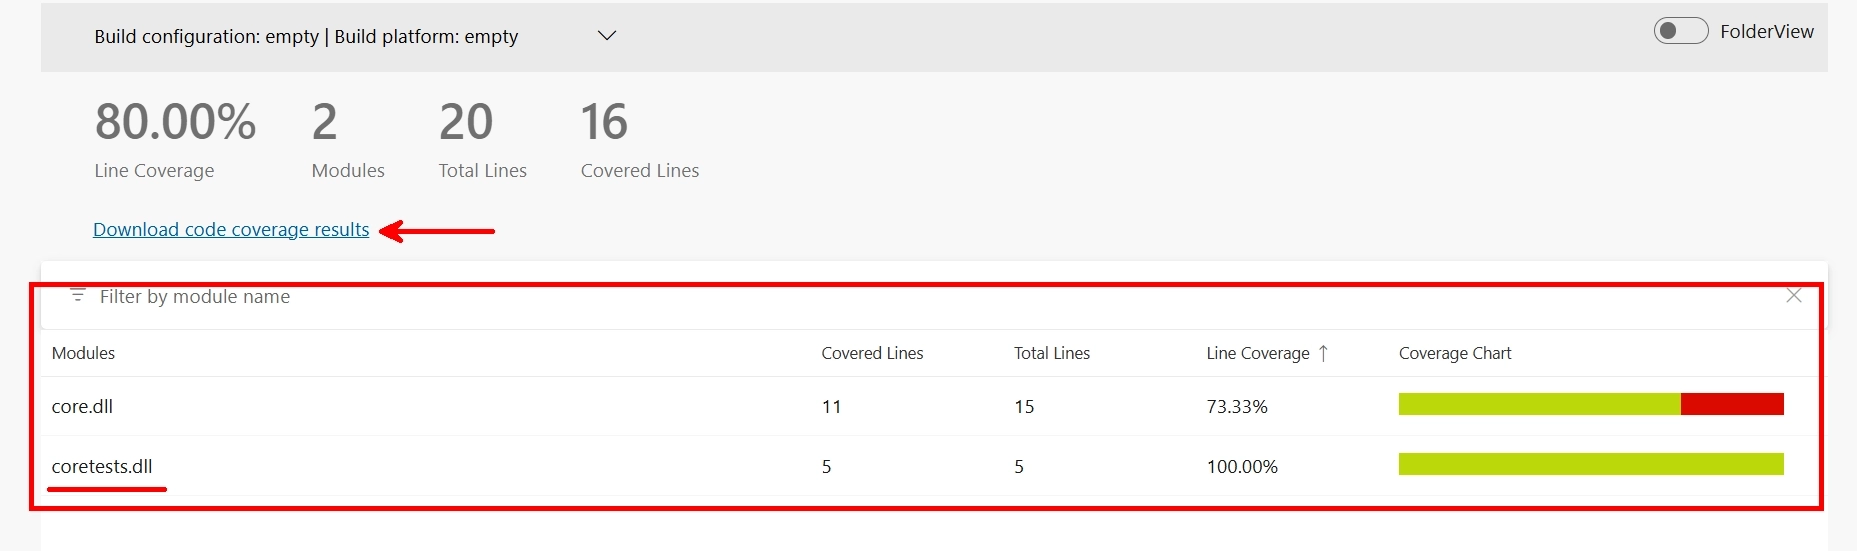
You can notice that the code coverage is also calculated for the test projects.
This can be OK, but it can also skew the results.
To exclude the test projects from the code coverage, you need to create a .runsettings file and specify the test assemblies to include or exclude.
Create a file called coverage.runsettings in the root of your repository with the following content.
To keep things simple, I'm only excluding the modules that end with Tests.dll.
For more information about the .runsettings file, see the *.runsettings file documentation.
When you have created the .runsettings file, you need to specify it in the test command using the --settings argument.
After running the pipeline, you should see that the code coverage is calculated without the test projects.
XPlat Code Coverage
To be fair, I don't know the exact details of the differences between the Code Coverage and XPlat Code Coverage (Coverlet) data collectors.
But, what I can do is describe the differences in behavior that I've noticed.
The XPlat Code Coverage data collector automatically excludes the test projects from the code coverage, which means you don't need to create a .runsettings file to exclude them.
The second difference is that while it calculates the code coverage, it doesn't show the results within the Azure DevOps pipeline.
An additional build step is needed to publish the code coverage results to Azure DevOps, for this the PublishCodeCoverageResults task is used.
The last difference is that the XPlat Code Coverage creates a coverage.cobertura.xml file, which cannot be downloaded nor opened in Visual Studio. To view the results, you need to use a third-party tool like Coverlet.
Maybe that there's a plugin for this, but I haven't searched for it.
The updated pipeline with the XPlat Code Coverage data collector looks as follows.
After running the pipeline, you should see the code coverage in the test results.
Format
To specify the format of the output file you can use the Format argument.
From my experience, this doesn't have a big impact on the capabilities and the results of the code coverage.
Pull request comments
To make the code coverage more visible, you can add a comment to the pull request with the code coverage percentage.
This is a feature that Azure DevOps provides out of the box. This feature works with both the Code Coverage and XPlat Code Coverage data collectors.
To enable this feature, create a azurepipelines-coverage.yml file in the root of your repository, and enable the comments option.
You can also specify a target percentage, which will be used to determine if the code coverage (for the added code) is sufficient.
After this change, the code coverage will be added as a comment to the pull request with each push.
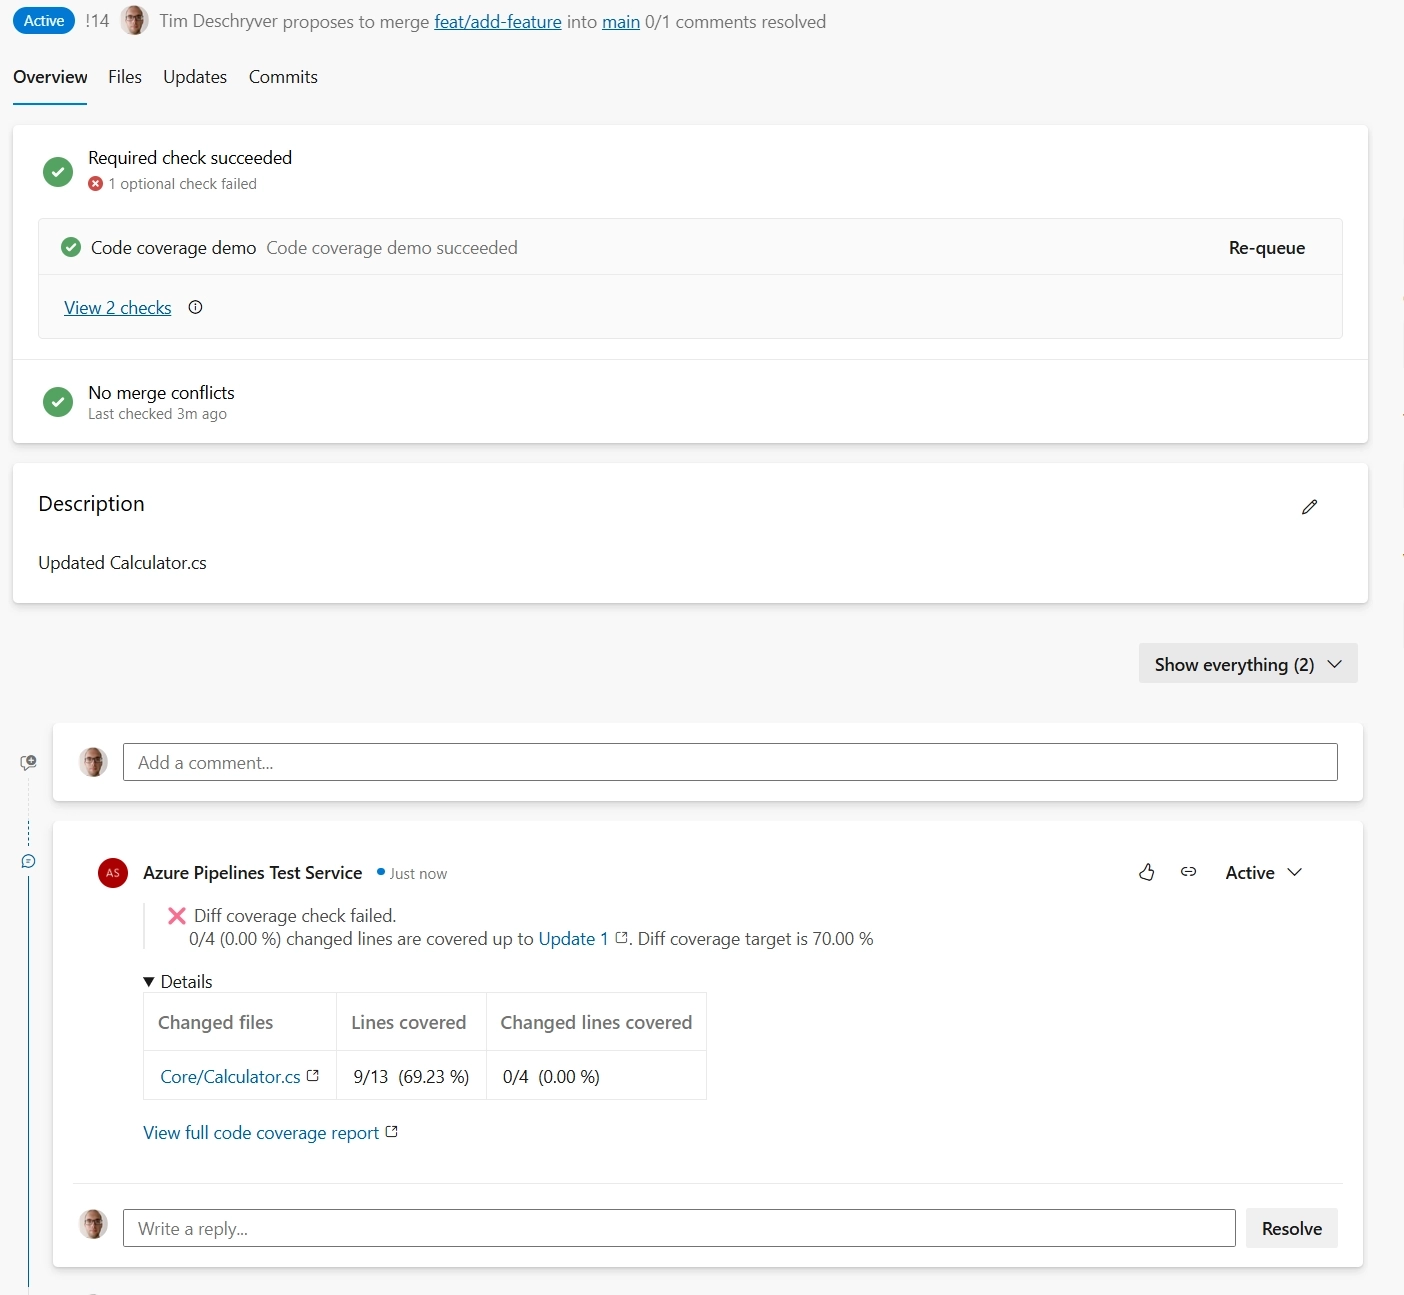
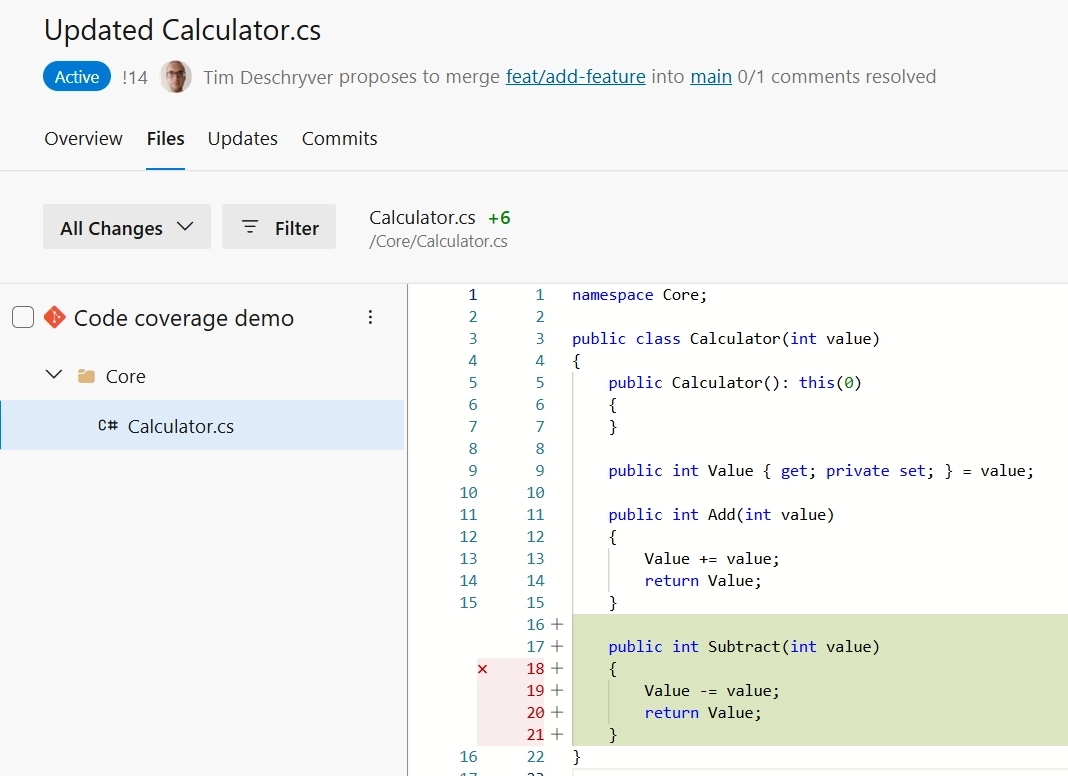
When reviewing the PR, this feature helps to investigate which lines are (not) covered by the tests. Within the code editor, you will see highlights in the gutter, which indicate the code coverage.
To ensure that the target is met to merge the pull request, you can add a "Status Check" via the branch policies view. This feature can be helpful to increase the code coverage over time.
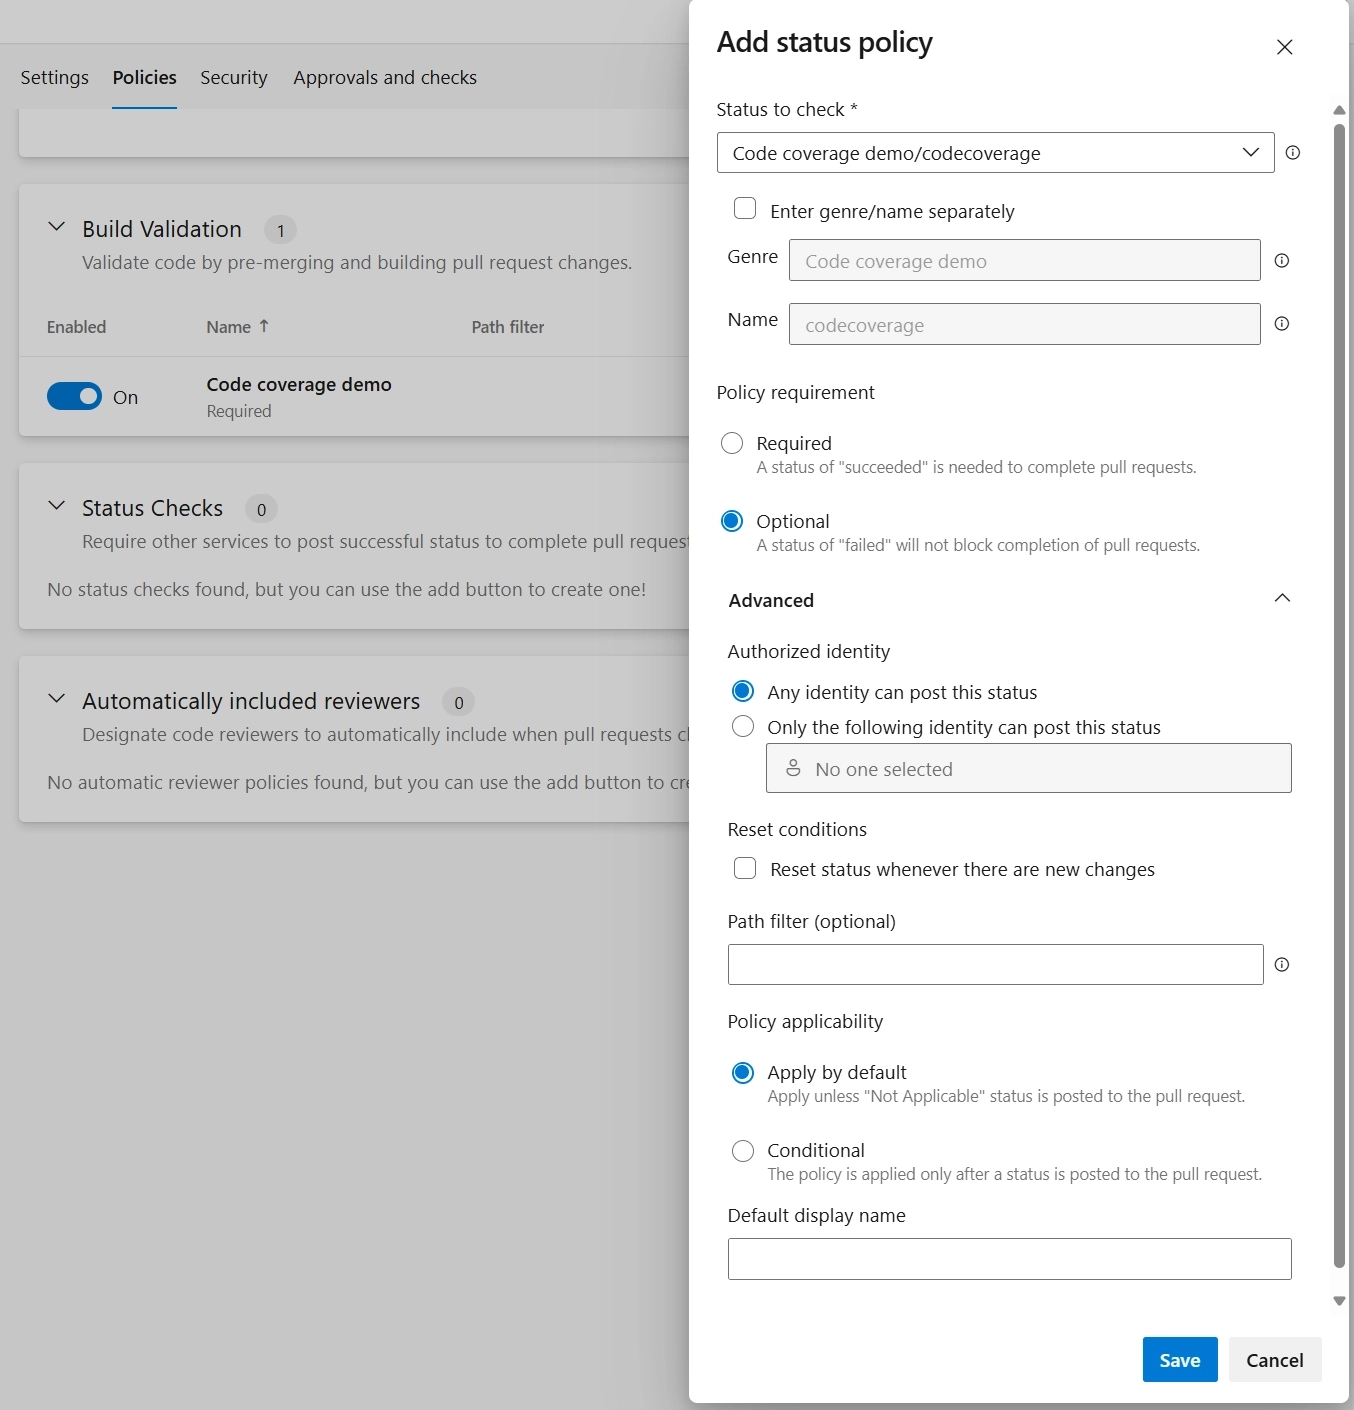
I suggest making this optional because it requires that the target is always met even when unrelated files are changed (docs, pipelines). I believe this is the case because the code coverage difference will be 0 in this.
Enforcing a minimum code coverage
To strictly enforce the code coverage, you can install and use the Build Quality Checks extension. This extension allows you to set a minimum code coverage percentage and fails the pipeline when the target is not met.
Code Coverage for different kinds of tests
The setup discussed in this post, works for unit and integration tests. Personally, I prefer the latter because I think they provide more value than unit tests.
If you're looking into writing integration tests for a Web API, you invoke the API endpoints and validate the response within the test cases. But... this can be challenging if the API expects an authenticated user. Stephan van Rooij wrote the following blog post Integration tests on protected API that explains in depth how to write integration tests for a protected API.
Conclusion
To be honest with you, I'm not a big fan of code coverage as a metric to measure the quality of a codebase. However, I do like the Pull Request comments feature, as it helps find uncovered paths during a code review. I believe that it raises awareness about the importance of adding proper tests, and reminds the team that some tests are in fact important.
To achieve this, I've shown you how to include code coverage to your Azure DevOps pipeline, and how to integrate it with the pull request comments feature.
Outgoing links
Feel free to update this blog post on GitHub, thanks in advance!
Join My Newsletter (WIP)
Join my weekly newsletter to receive my latest blog posts and bits, directly in your inbox.
Support me
I appreciate it if you would support me if have you enjoyed this post and found it useful, thank you in advance.
